Analysing Captured Application Data
Once the server has been installed, and started, you will be able to start up the user interface by pointing a browser to: http://localhost:<port>;
Where 'port' is the port used by the server (e.g. 8080 by default).
At this point, you will be prompted to login.
|
Note
|
If starting the server for the first time, you will need to create a user. See the previous section for instructions on how to do this. |
Components

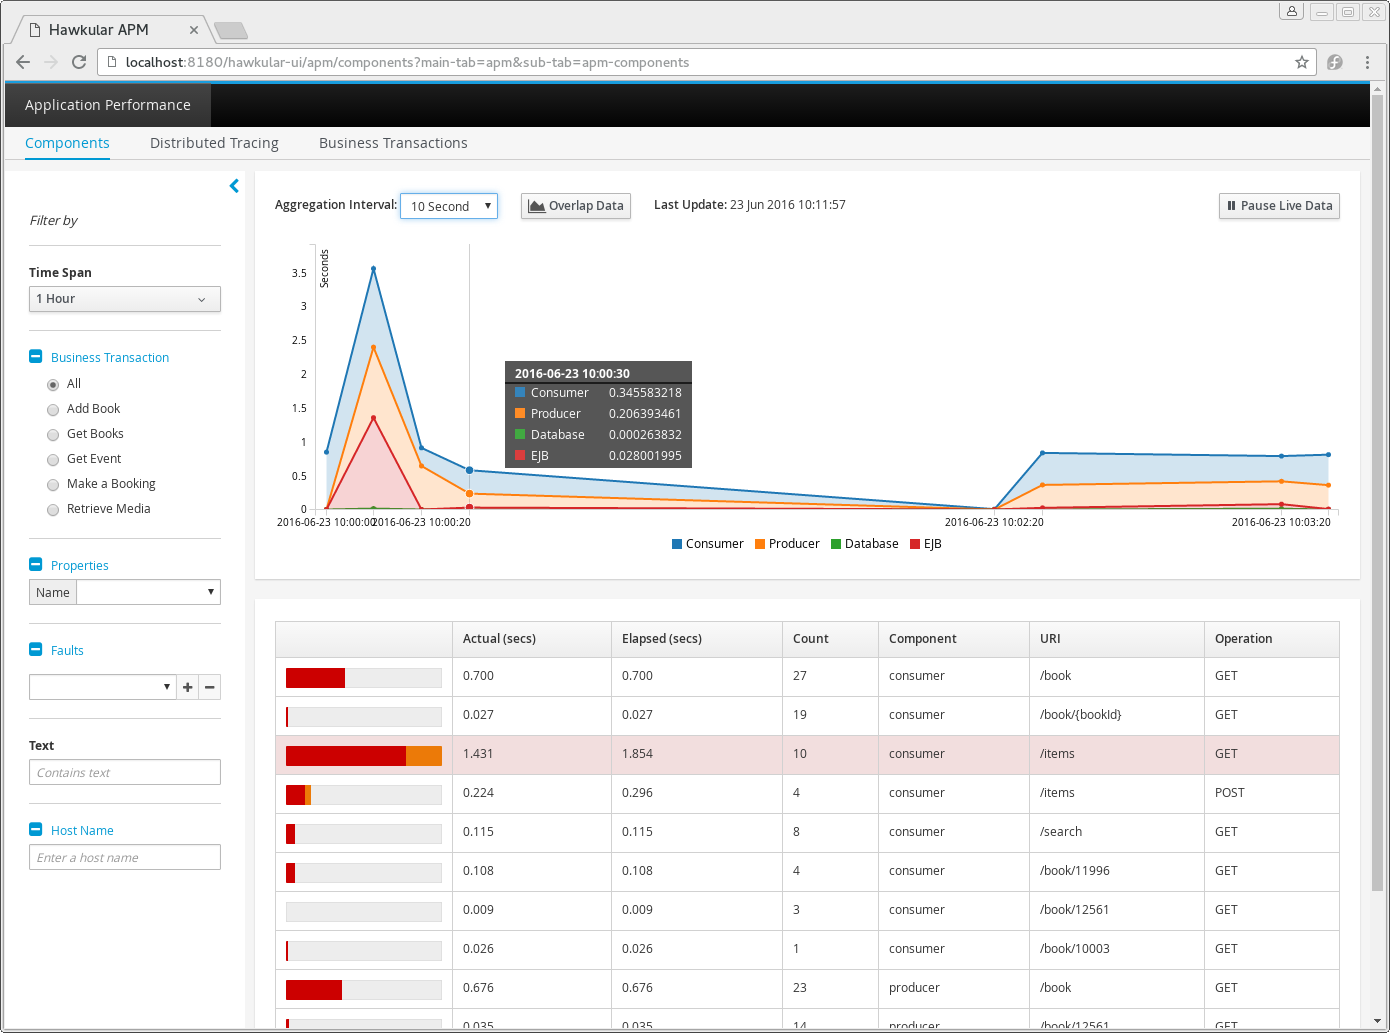
This page shows component information related to the applications being monitored.
The lefthand side of the page provides a collapsible sidebar with various filters that can be applied to the information being viewed. This is explained in more detail in a later section.
The graph shows aggregated durations for the component types being monitored, at the defined intervals. The interval can be changed using the dropdown at the top of the graph.
The table presents the performance information aggregated based on the component type (e.g. Database, EJB, Consumer, etc), URI and (if relevant) operation name.
The metrics provided are count (the number of activity records aggregated), the elapsed time and actual time. The elapsed time represents the total time spent within a particular component (including calls to child components), as demarcated by a span start and finish. The actual time represents an estimate of the amount of time spent in the component itself, by deducting the time spent in the child components. This estimate is most accurate when all of the child components are performed synchronously (in sequence). If some are performed asynchronously, then the result will be an approximation.
This information can be used to identify performance bottlenecks within an application. Using details about the amount of 'actual' time specific within a component, combined with the number of times it is invoked, can help locate the best opportunities for making performance improvements.
Distributed Tracing
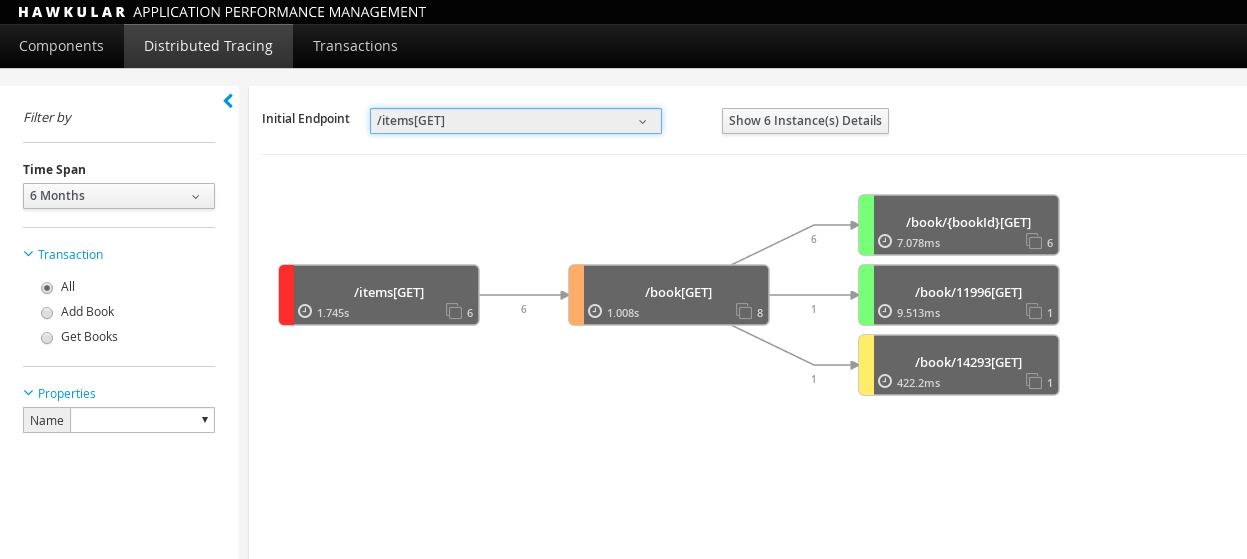
This page shows a graphical representation of the path taken by interactions through a set of distributed services.
The lefthand side of the page provides a collapsible sidebar with various filters that can be applied to the information being viewed. This is explained in more detail in a later section.
At the top of the graph is a dropdown providing a list of initial (root) nodes for the paths that can be displayed. Once a path is selected, the invocation path will be displayed as a set of connected nodes.
Each node reflects its severity as a colour, ranging from green meaning performing well, up to red indicating an area for further investigation.
The nodes also provide information about the average duration spent in the node, the number of times the node has been invoked, and provides a tooltip with more detailed stats.
The links also provide information about the number of invocations, and a tooltip with more detailed stats.
The graph can be zoomed and scrolled to view the relevant parts of the information. There is a 'reset zoom' button to return to the original (initial) version of the graph.
At the top of the page is another button showing the number of trace instances that comprise the aggregated service interaction view. If this button is selected, it shows a table of the individual instances.
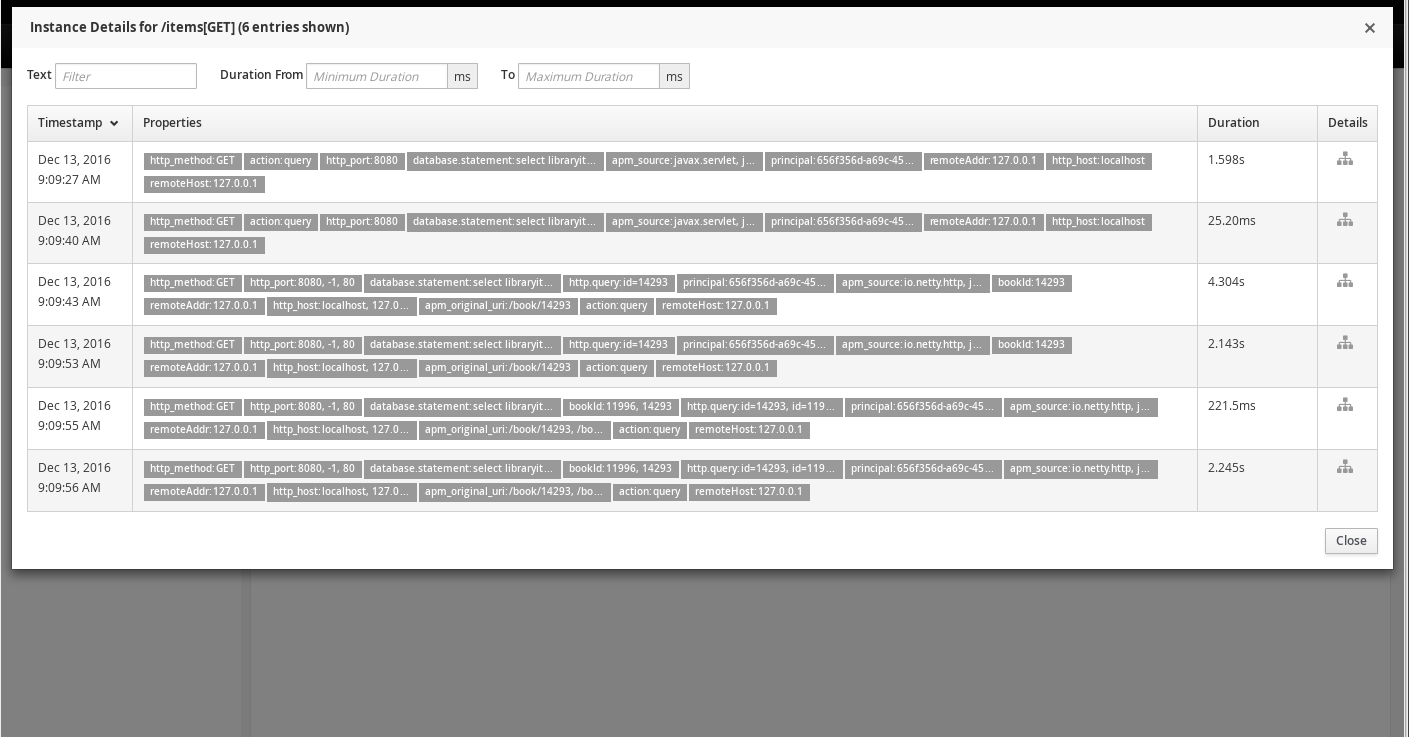
The instances can further be filtered by entering some text, or by providing a duration range, in the fields at the top of the table.
Once an instance of interest is located, the Details column icon can be selected to show a diagram of the call trace instance.
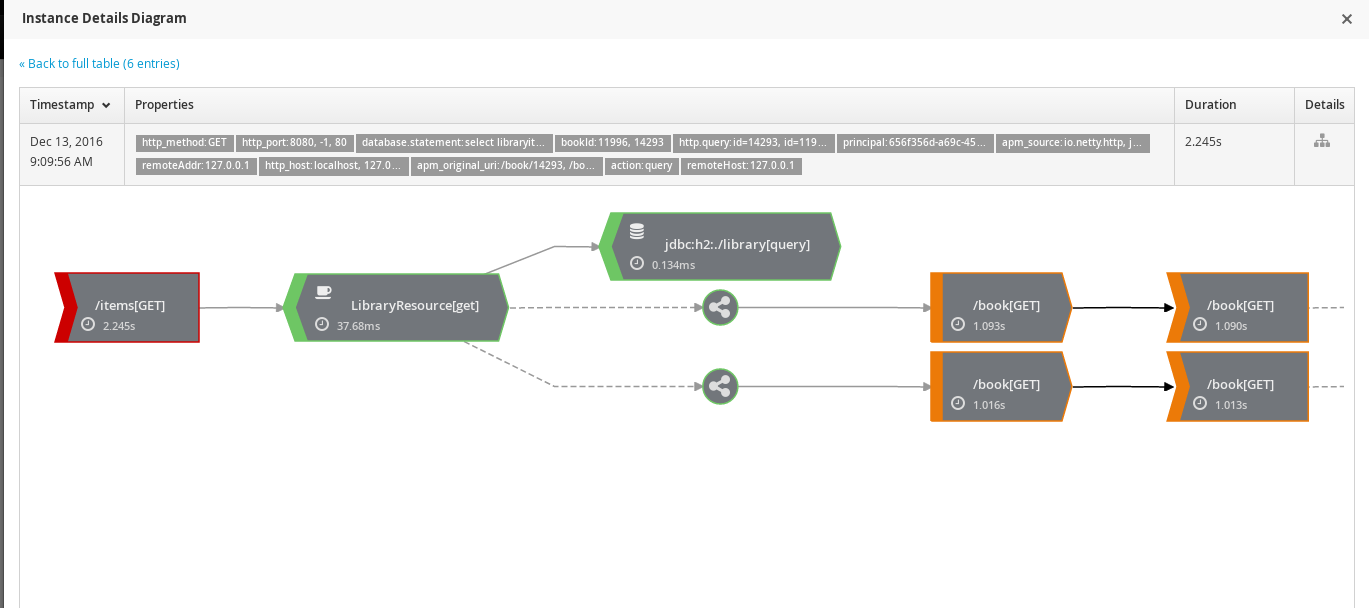
The symbol on the left of the diagram represents the consumer of a message. Solid grey lines show control flow.
The hexagon represents a component, with an icon identifying the type of component. In the above image, the first component is an EJB as indicated by the coffee cup. The second component is a database activity.
The dotted grey line represents a concurrent activity being performed. In this case two separate concurrent activities are performed within the scope of the EJB, after the database query.
Each of the concurrent activities have the same pattern in this example image. They start with a 'producer' (or service invocation) calling another service. The communication across service boundaries is represented by a solid black line. The invoked service (associated with the URL /book in this case) then triggers another concurrent activity which invokes a further service.
Transactions
This page shows information about the named transactions, separated into tabs for the following categories.
Managed
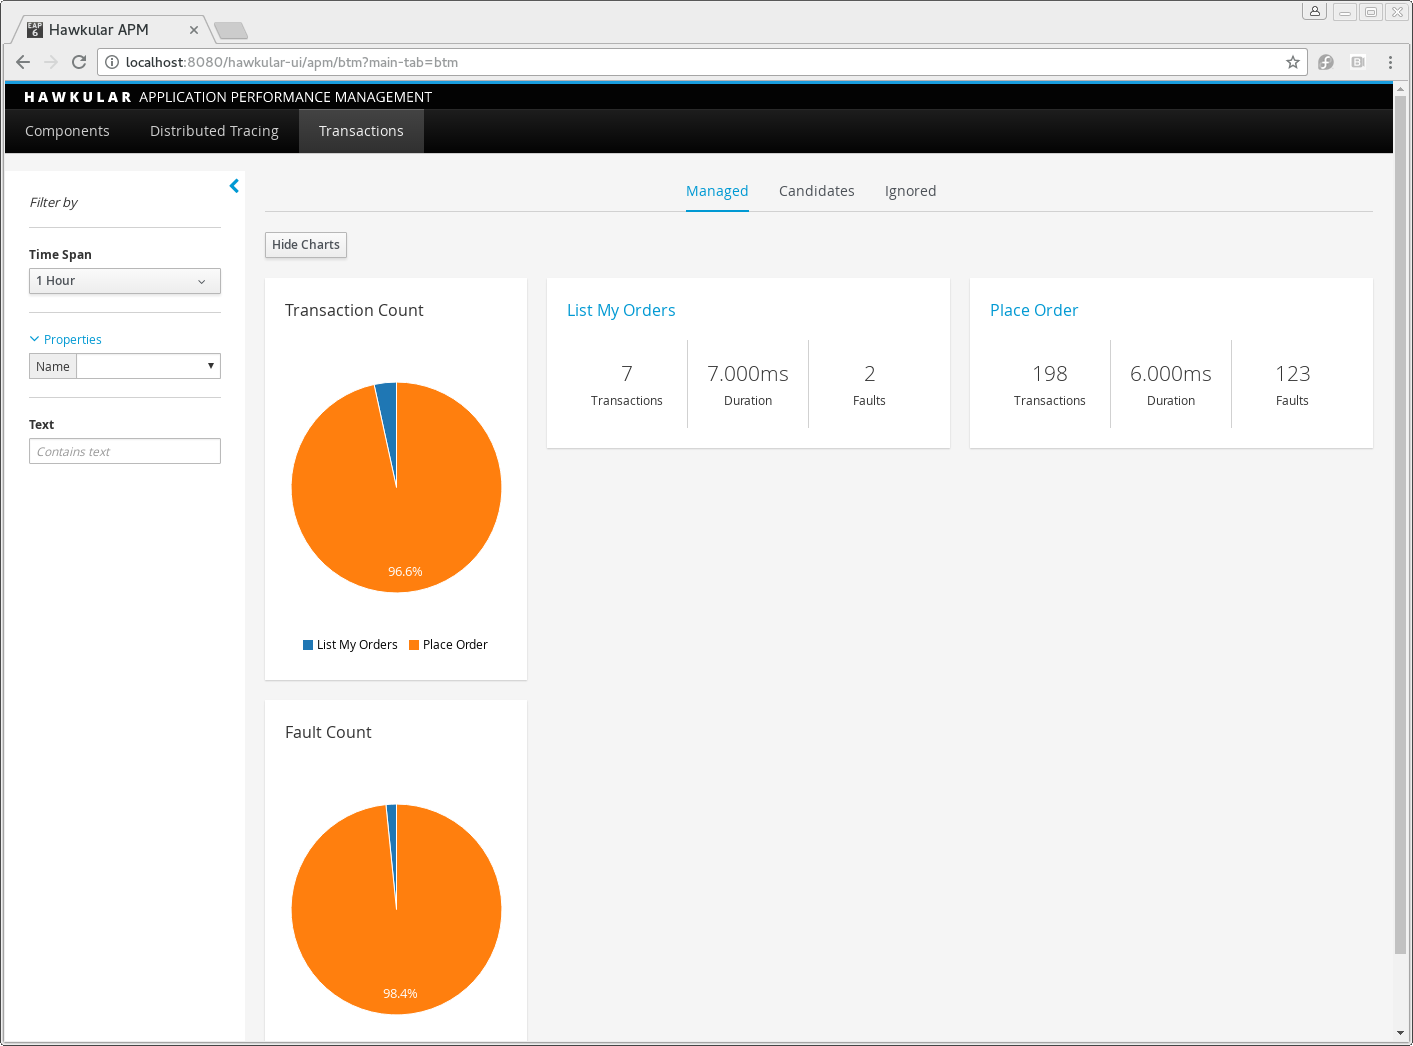
This tab shows summary statistics for a list of actively managed or disabled transactions.
The lefthand side of the page provides a collapsible sidebar with various filters that can be applied to the information being viewed. This is explained in more detail in a later section.
Next to the sidebar is two pie charts representing the transaction and fault counts across the transactions.
Each transaction is further presented with the following statistics:
-
The number of completed instances of the transaction
-
The completion time 95 percentile
-
The number of instances that completed with faults
For each transaction:
-
Users can navigate to the detailed statistical information about the transaction by selecting the transactions names.
-
If available, selecting the cog icon will take the user to the named transaction’s configuration page. The cog is only visible for transactions defined via the UI (i.e. not explicitly by the application).
-
The trash icon is used to delete the transaction. As with the cog icon, it will only be visible if the transaction was created via the UI.
Candidates
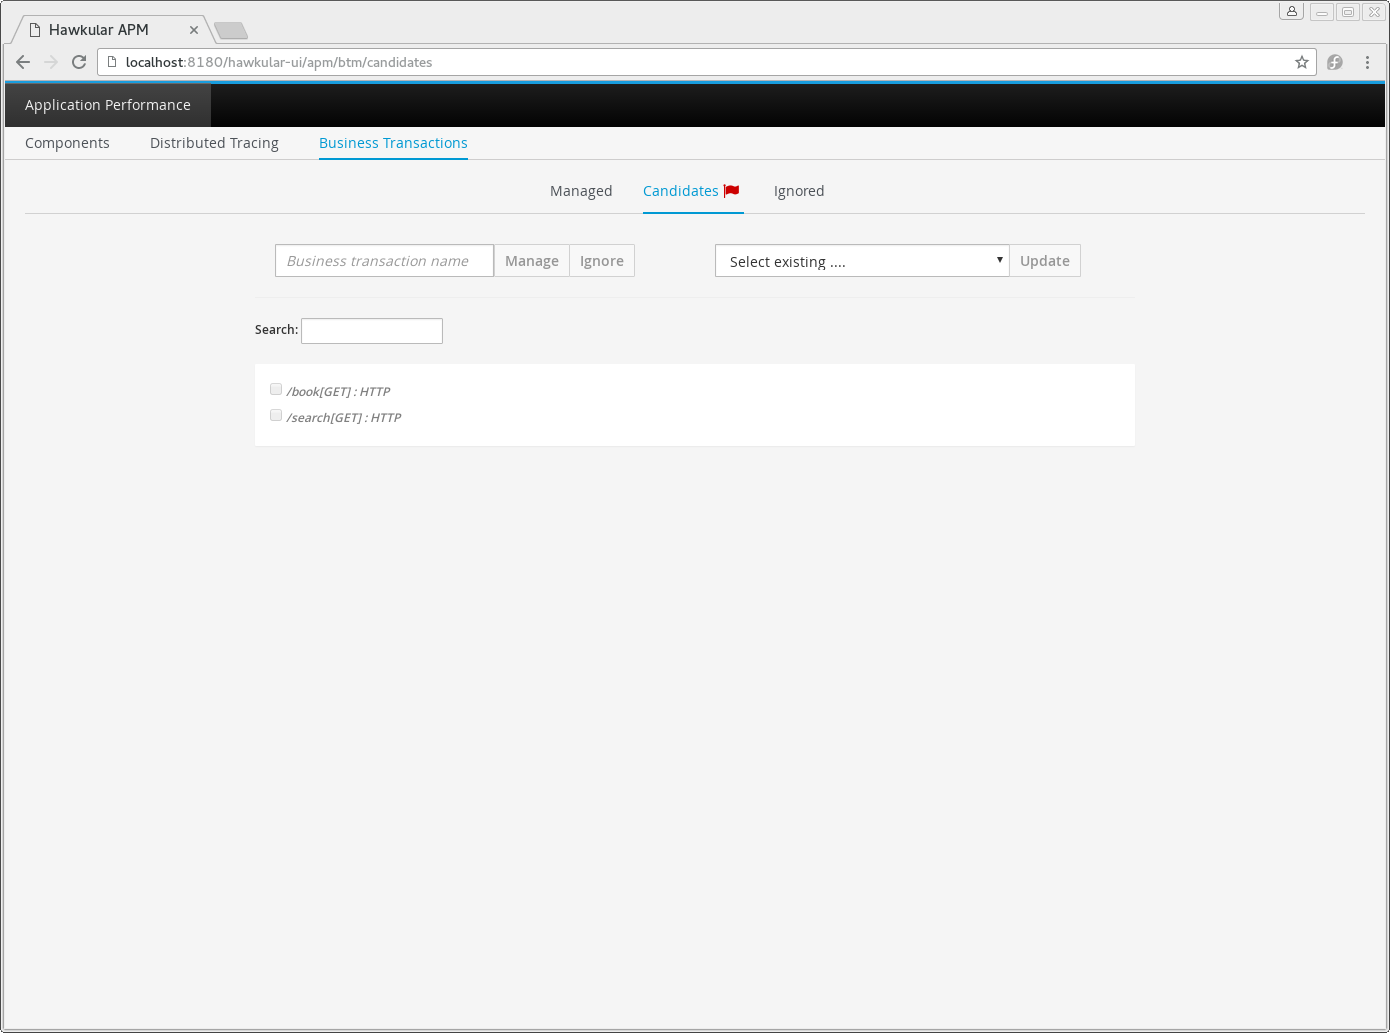
The candidates tab is used to identify interactions (associated with URIs) that have not currently be associated with a named transaction. When new URIs are detected, a red flag symbol will appear next to the Candidates tab name.
At the top of the page, it is possible to either enter the name of a new transaction, or select one of the existing named transactions from a drop down list. Once a name has been entered, or existing one selected, then the list of URIs will become enabled.
The user can select zero or more of the URIs that are appropriate for the named transaction. These URIs will be used to create inclusion filters (regular expressions) that will enable the interactions associated with those URIs to be allocated to the named transaction.
To avoid having an extremely long list of URIs, where a REST call involves a URI with one or more path parameters, the system will attempt to identify common patterns, and where found, present a single URI with the '*' meta character in place of the path segment associated with a parameter. If the user selects such a URI to be associated with a named transaction, this will result in an 'evaluate URI' action automatically being defined, to extract the path parameter(s). An effort is made to infer the name of the parameter(s), but these may need to be manually edited to define a meaningful name.
If a new named transaction is being created, then the user can click either the Manage or Ignore buttons. This will determine the initial reporting level of the transaction, as to whether instances of this transaction will be reported to the server (i.e. managed) or not (i.e. ignored).
If an existing named transaction is selected, then pressing the Update button will associate the inclusion filter for any checked URIs with the existing named transaction.
Whichever button is selected, the user will be taken to the configuration page for the named transaction. See the following section for information on how to configure the transaction.
Ignored
This tab lists the named transactions that are being ignored.
This state exists to enable named transaction instances to be categorised, and permanently marked as not being of interest. By explicitly identifying even business interactions that are not of interest, it is possible to detect any new traffic that may occur that has not previously be categorised, which informs the administrators that attention is required to investigate the unfamilar interactions.
Information
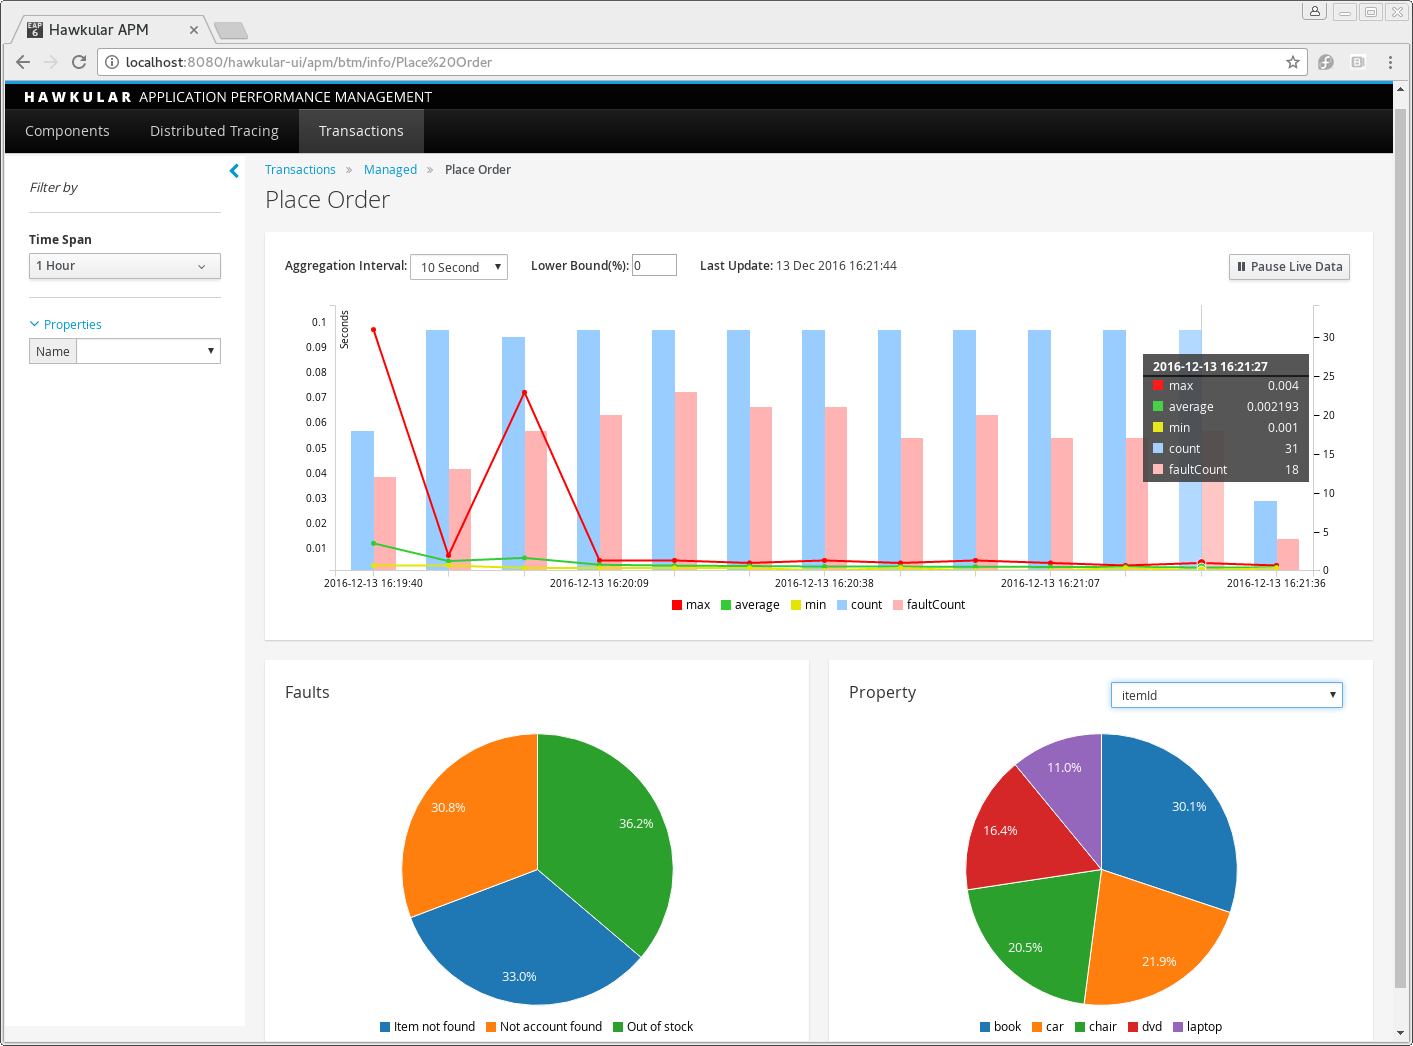
The lefthand side of the page provides a collapsible sidebar with various filters that can be applied to the information being viewed. This is explained in more detail in a later section.
The remainder of the page is divided into three regions.
The top graph shows an aggregated view of the stats associated with completed named transactions subject to any defined time span and other filter criteria (e.g. faults and/or properties). The stats are displayed as line charts for min, average and max values. A bar chart is used to display the number of transactions, and the number of transactions that completed with a fault.
The left hand bottom pie chart displays the faults that occurred. If a pie chart segment representing a particular fault is selected, it will add that fault as a filter, focusing all the data in the other charts on the named transactions associated with that fault.
The right hand bottom region defines the named transaction properties that are available. The user can select a particular property from the dropdown menu, and its information will be displayed in a pie chart. As with the fault pie chart, selecting one of the pie chart segments will add that property name and value as a filter on the data viewed in the page.
Both the fault and property filters are displayed at the top of the page. When displayed in green, they will filter out named transactions with that fault or property value. If however the user selects the filter, it will toggle to become red, representing the fact that data should be shown that does not contain that fault or property value.
Configuration
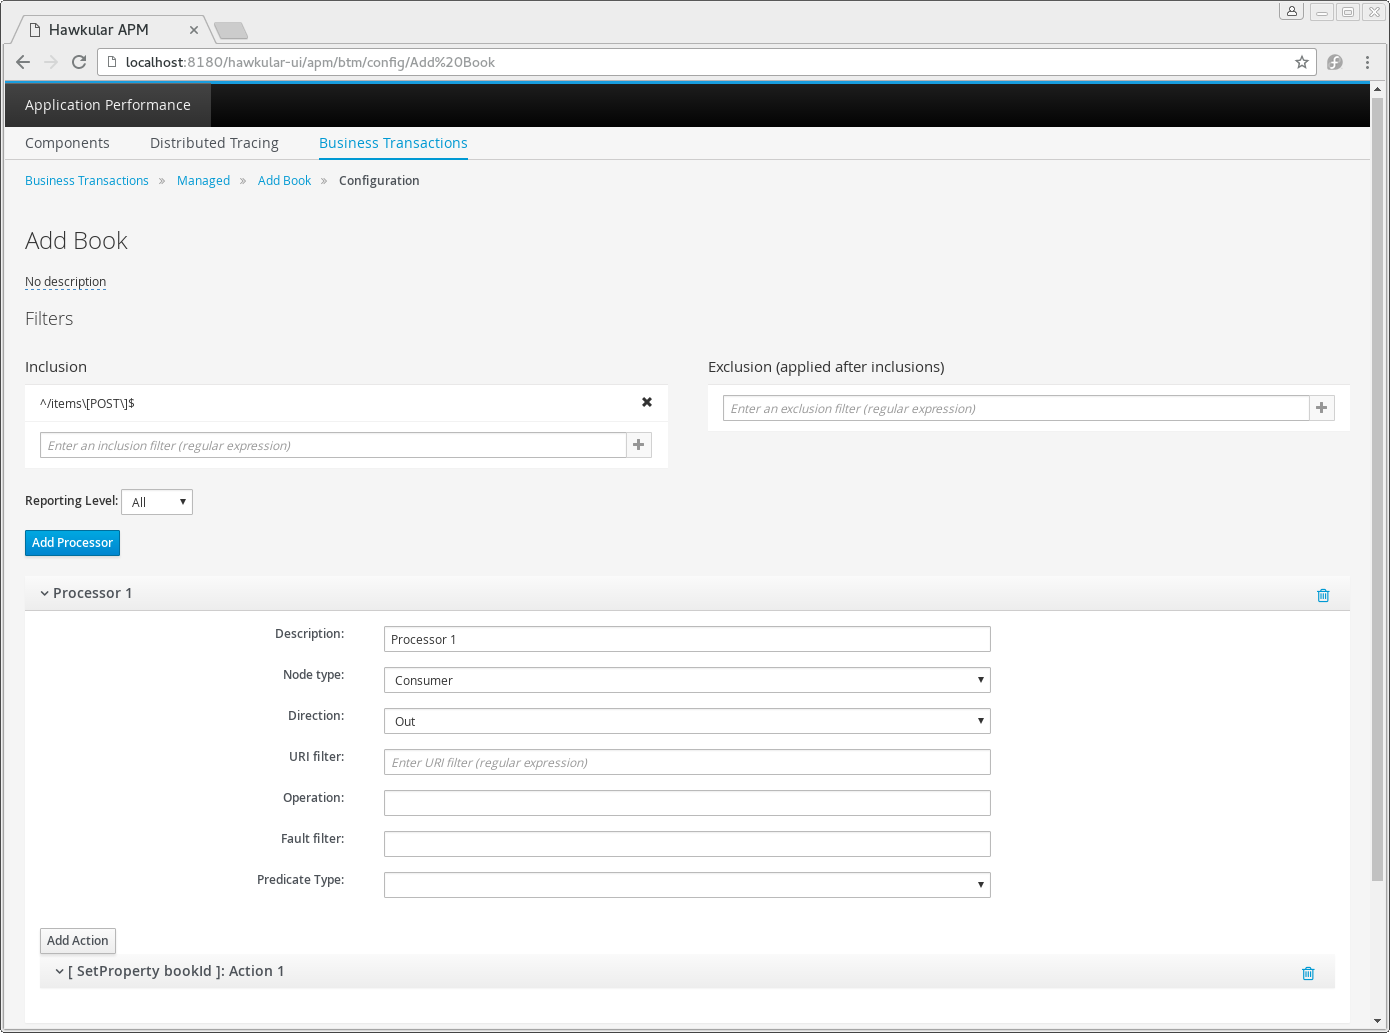
Whenever changes are saved, or the form is initially displayed, any validation errors will be displayed. Errors will also be highlighted on the form, by the appropriate field labels being displayed in red.
The configuration for a named transaction is separated into three sections.
Description
Simply enables the user to provide a description of the named transaction and its scope (in case it incorporates a number of different invocations).
Filters
The filters section defines the link between the transaction instances, performed on specific URIs, and the transaction name.
This is achieved by defining one or more inclusion filter regular expressions that may match a URI. Once a URI is matched against one of the inclusion filters, it may then be matched against the exclusion filter regular expressions (if defined) to determine if a subset of the included URIs should be excluded.
Once a transaction instance has been associated with a named transaction, the Reporting Level is used to determine how that transaction instance should be handled.
| Level | Description |
|---|---|
All |
This level means that all information about the named transaction should be reported |
None |
This means that the named transaction is temporarily disabled so no information should be reported |
Ignore |
This means that the named transaction is permanently disabled so not of interest |
Processors
Out of the box, Hawkular APM is configured with instrumentation rules for a selection of technologies, that can used to monitor generic information about named transaction instances executing over those technologies.
However, to make this information more useful in a business context, it is important to also be able to extract relevant details from the business messages, to aid future analysis. This section will explain how the additional "business transaction specific configuration" can be provided.
Zero or more processors can be defined for a named transaction. If none are defined, then the named transaction configuration will simply be used to associate specific interactions with the transaction name.
If a processor is defined, it is comprised of an initial set of parameters to identify which specific node(s) in the trace are to be processed, and then a set of actions that should be performed. The actions will be discussed further down.
| Field | Description |
|---|---|
Node Type |
This field identifies the type of call trace node that the processor will be applied to, with possible values of Consumer, Producer or Component |
Direction |
The direction the interaction being processed will flow, either In or Out |
URI Filter |
Regular expression that can optionally be defined to isolate the nodes of interest, where multiple nodes of the same type may occur within the same transaction instance |
Operation |
For Component node types, the optional operation name can be used to identify a specific node in the call trace |
Predicate |
A predicate can be defined to provide finer grained filtering on whether the processor should be applied to a particular call trace node, which by default is not specified |
As mentioned, each processor can define multiple actions to be performed on nodes that meet the criteria associated with the processor. For example, the following action is used to set a property on the trace.
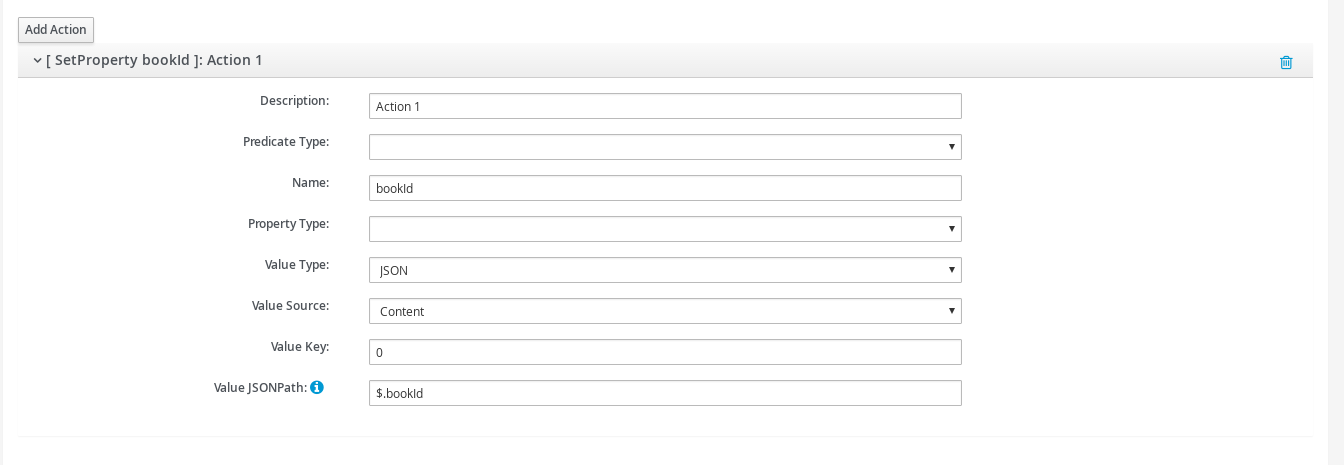
Each action can also be guarded by its own predicate, so that not all actions will be performed for each node that passes the processor’s overall criteria. The default is no predicate for the actions.
The fields that need to be defined for an action will be specific to the action type, and therefore are listed in the description fields for the action:
| Action Type | Description |
|---|---|
Add Content |
Include content in the trace fragment node. Fields are 'name' to distinguish content if multiple entries will be defined, 'type' to classify the content type, and an expression (see below) to determine how the content is derived |
Evaluate URI |
Apply a template to the URI to extract path and query parameters, e.g. /customer/{customerId} or /orders?{id} |
Set Property |
Extract a named business property. The 'name' field names the business property, and the expression (see below) determines how the value is derived |
| Expression Type | Description |
|---|---|
Literal |
A literal value. When used as a predicate, only values true or false are valid. |
XML |
XPath expression applied to a XML document. The Source field identifies where the information is obtained from (e.g. Content, Header). The Key is dependent upon the source, if Content then the key represents the index in an array of arguments, if Header then the key is the header property name. |
JSON |
JSONPath Expression applied to a JSON document. The Source field identifies where the information is obtained from (e.g. Content, Header). The Key is dependent upon the source, if Content then the key represents the index in an array of arguments, if Header then the key is the header property name. |
Text (for Values only, not Predicates) |
Converts a value into text form. The Source field identifies where the information is obtained from (e.g. Content, Header). The Key is dependent upon the source, if Content then the key represents the index in an array of arguments, if Header then the key is the header property name. |
Filter Sidebar
On the lefthand side of most of the UI pages is an area for specifying filters that can be used to limit the information being viewed.
The Transaction list will include any named transactions that have been defined. This can be used to focus the presented information just on a specific transaction to help identify performance bottlenecks.
The Properties section enables properties associated with traces to be used to define inclusion or exclusion filters. The name of the property can be selected from a dropdown.